By Rejhan Kavazbasic · 6 min read · Updated 30 October 2026
How to read a frequency-response graph
What the squiggly line means, why IEMs peak around 3 kHz and how to use a graph to compare two models.
The axes
Horizontally is frequency: deep bass (20 Hz) on the left, the highest treble (20 kHz) on the right. Vertically is loudness in decibels. The higher the line, the louder that part of the sound.
| Region | Frequency | What you hear |
|---|---|---|
| Sub-bass | 20 to 60 Hz | Rumble and pressure, mostly in electronic music and film |
| Bass | 60 to 250 Hz | Kick drum, bass guitar, warmth |
| Mids | 250 Hz to 2 kHz | Vocals, guitar, piano |
| Presence | 2 to 5 kHz | Clarity of vocals, attack |
| Treble | 5 to 20 kHz | Cymbals, air, sibilance |
Why the 3 kHz bump is normal
Your ear canal naturally boosts sound around 2 to 4 kHz. Measuring rigs simulate an ear, so even an IEM that sounds neutral shows a peak there. That's why our graphs have a dashed line: the Harman IE 2019 target. It describes what most listeners in research perceive as natural.
Read the difference
Look at the gap between the coloured line and the dashed line, not at how high the line itself is.
Recognising signatures
A few rules of thumb: above the target in the bass means warmer and fuller. Below the target around 3 kHz means relaxed vocals. Extra energy between 5 and 10 kHz sounds bright, and with too much, sharp or sibilant.
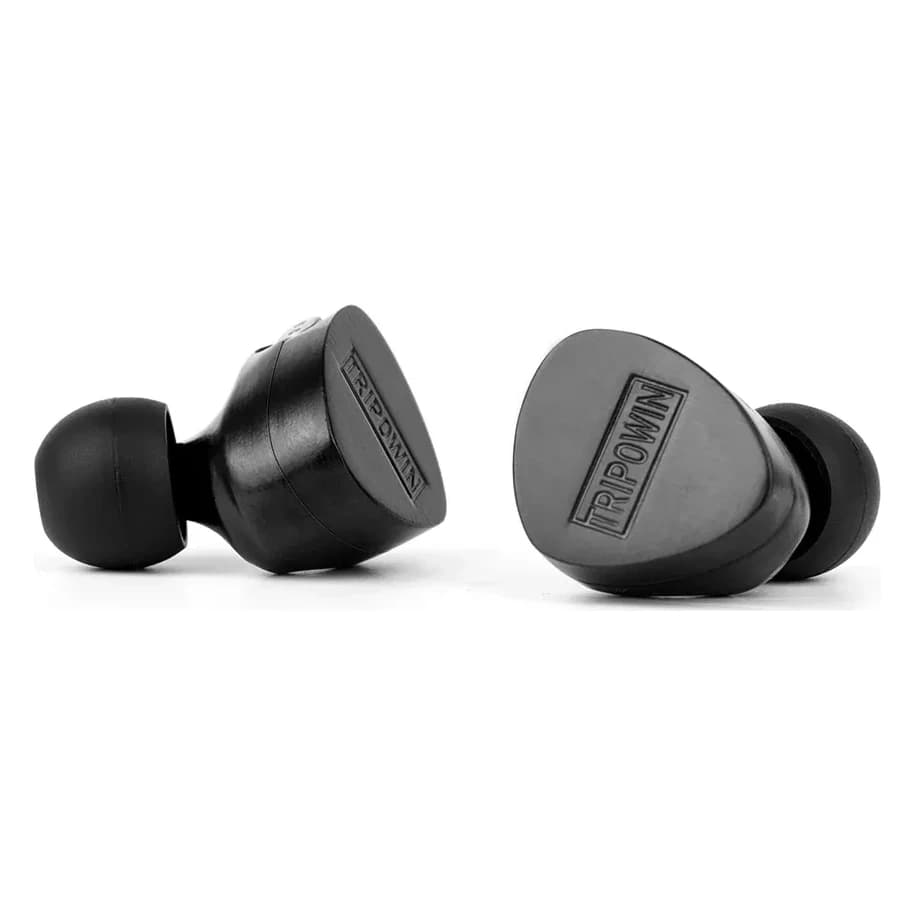
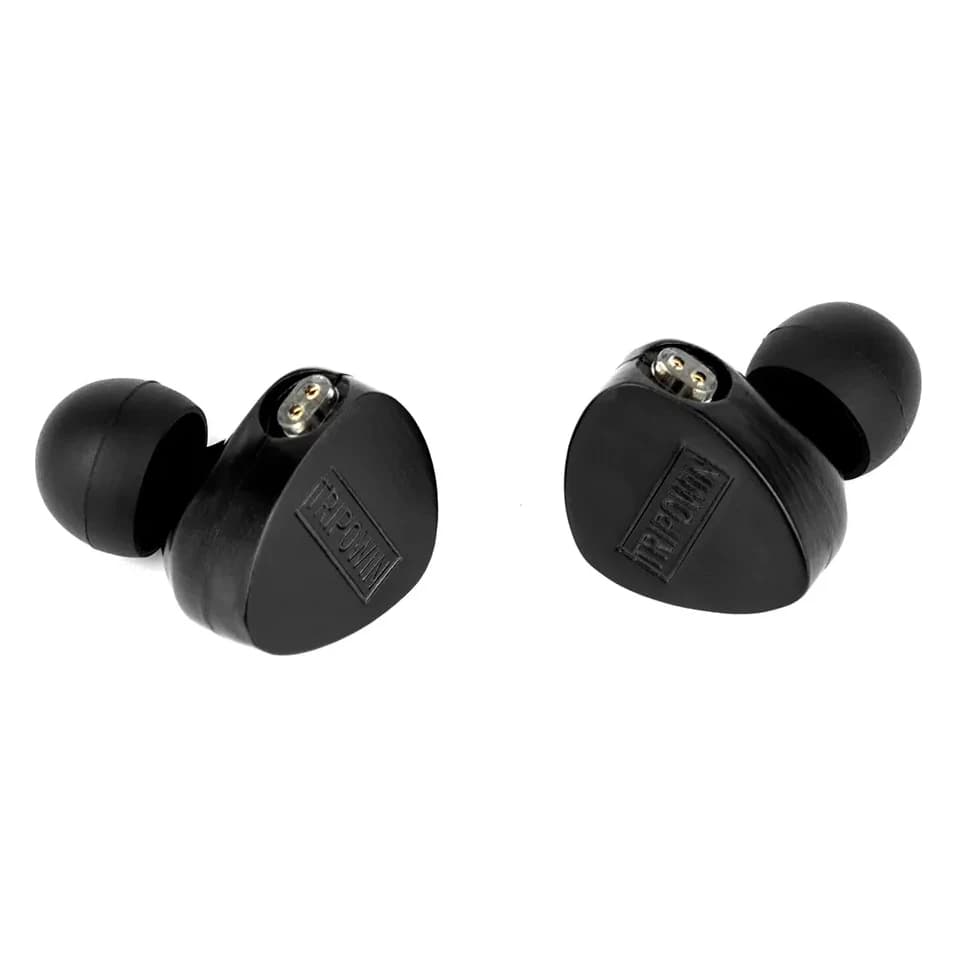
- EDX Pro
- Leá
Measured by Super* Review (IEC 711 clone), published on squig.link. Independent measurement, not by us. Measuring rigs differ slightly above 8 kHz.
If the line drops away steeply on the left, the IEM has little sub-bass. That's not necessarily a problem: for vocals and acoustic music it can sound clean and tight.
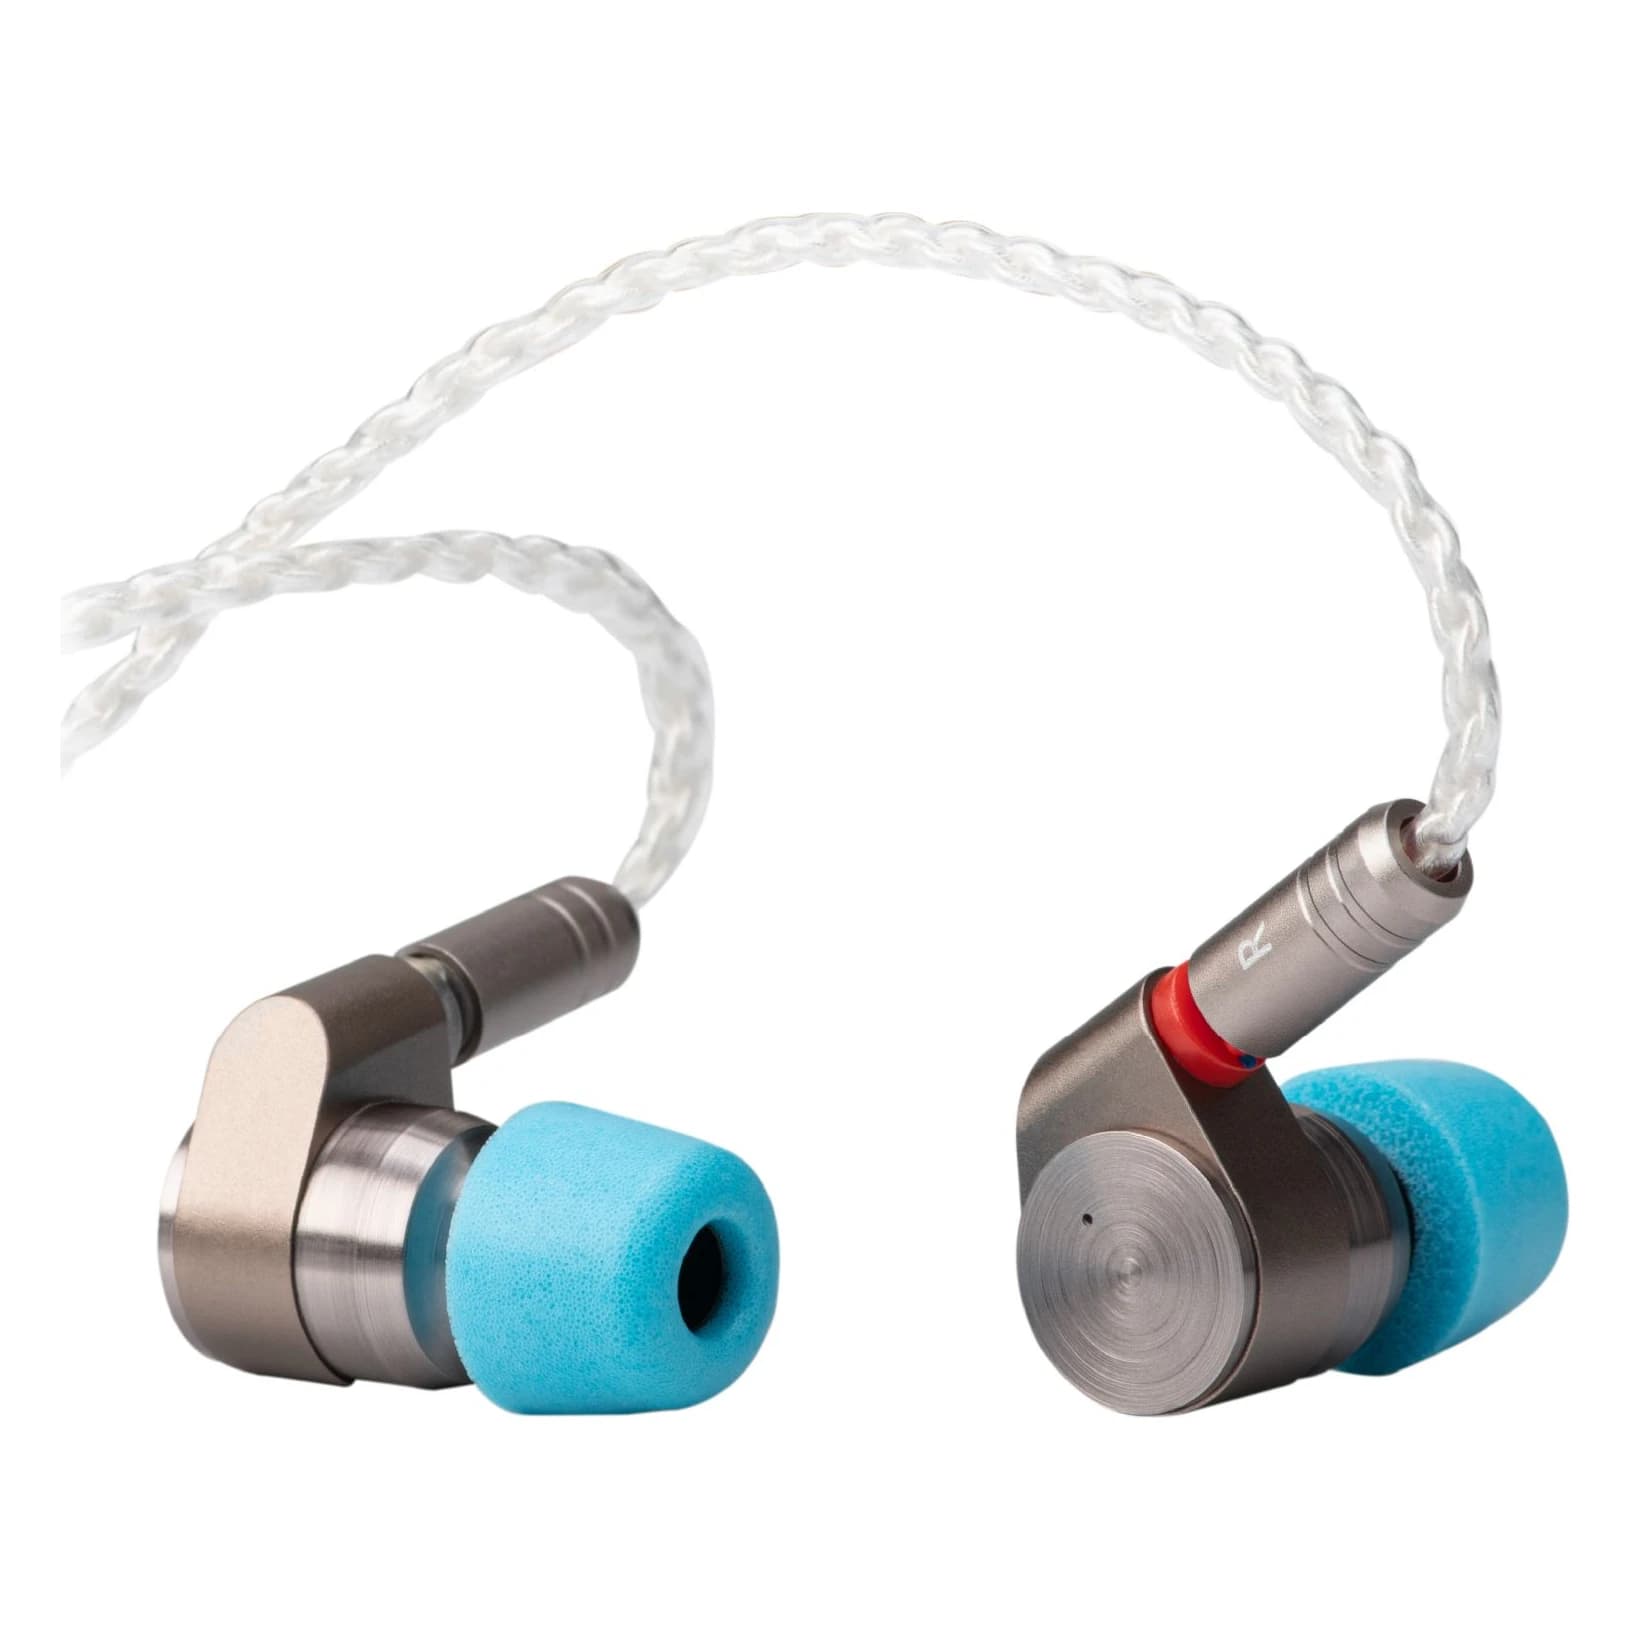
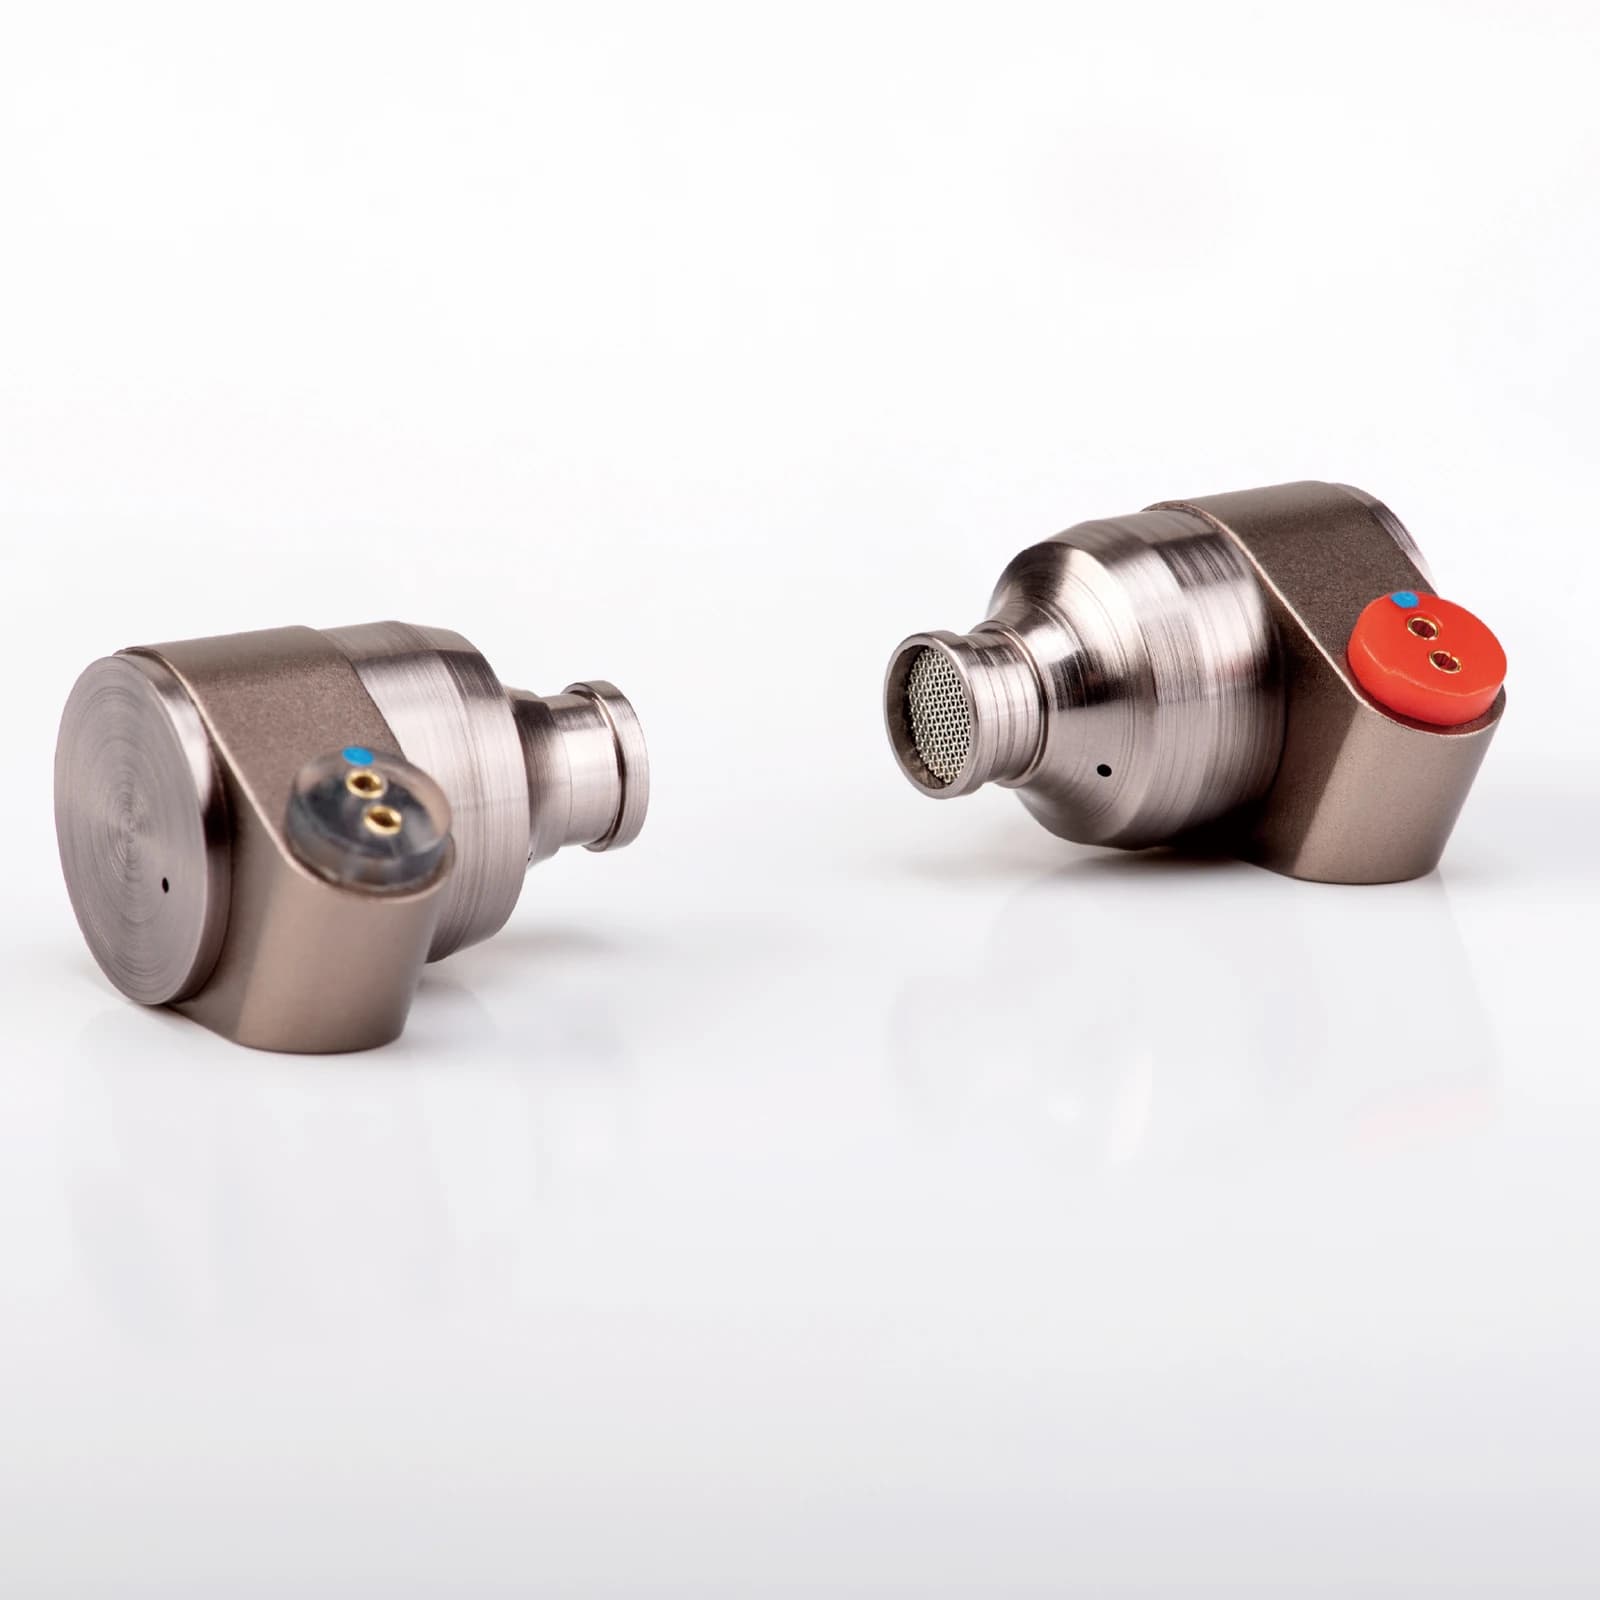
- T2
Measured by Super* Review (IEC 711 clone), published on squig.link. Independent measurement, not by us. Measuring rigs differ slightly above 8 kHz.
Only compare like with like
Every measuring rig gives a slightly different curve, especially above 8 kHz. A difference of a few decibels there can come from the rig rather than the IEM. That's why every graph on our site says who measured it and on which rig. Ideally, compare two models with measurements from the same source.
- Look at the bass first: above or below the dashed line?
- Then the region around 3 kHz: that's where vocal clarity lives.
- Finally 5 to 10 kHz: peaks there sound sharp.